Prototypes
This page collects personal analytical prototypes, small data products and experiments.
They are artifacts from a learning-by-doing process in which I explore how current AI developments can make data analysis more accessible and interactive, reveal more insight from existing data, and augment or automate parts of analytical workflows.
Driver Prioritization Workflow
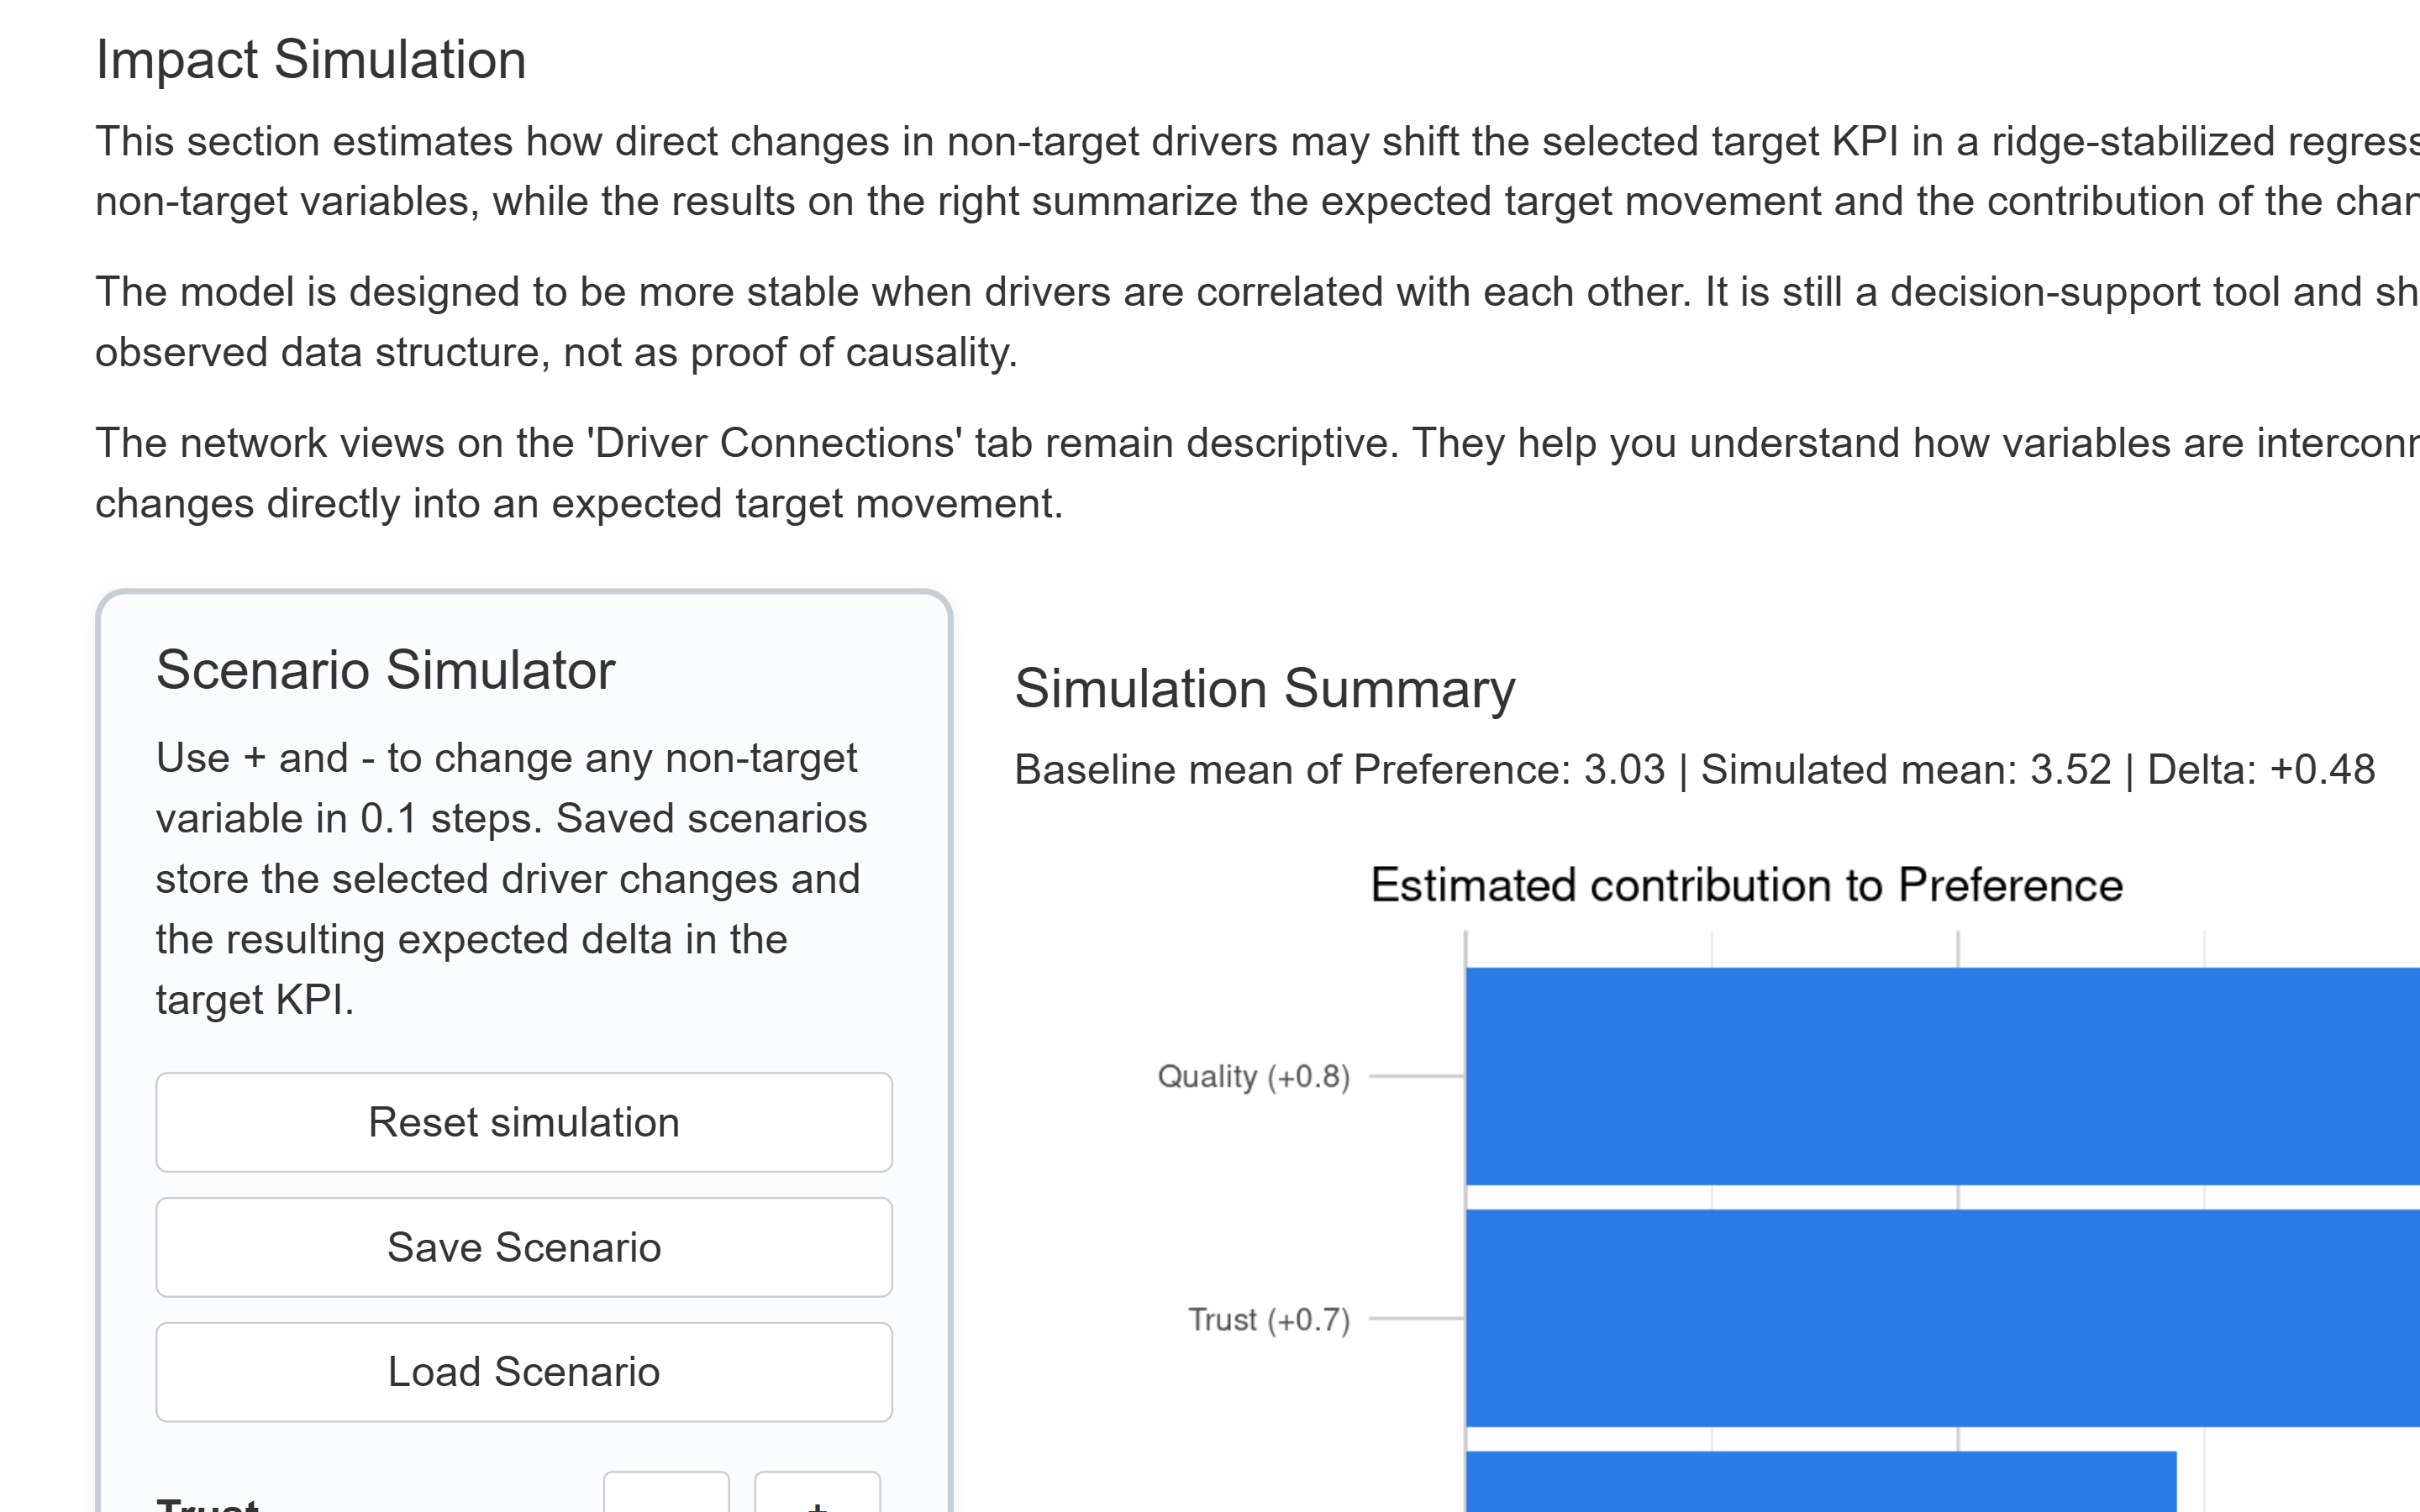
An interactive prototype for exploring drivers, priorities and decision-relevant patterns in survey data.
The app demonstrates how analytical results can move beyond static output and become a more dynamic decision-support environment for stakeholders. It was also an attempt to explore how AI-supported development can make it much faster to turn research results into stakeholder-oriented apps, complementing traditional reports with more interactive and explorable deliverables.
Status: Prototype
Topics: Driver analysis, survey data, decision support, interactive analytics, R, Shiny
DWD Temperature App
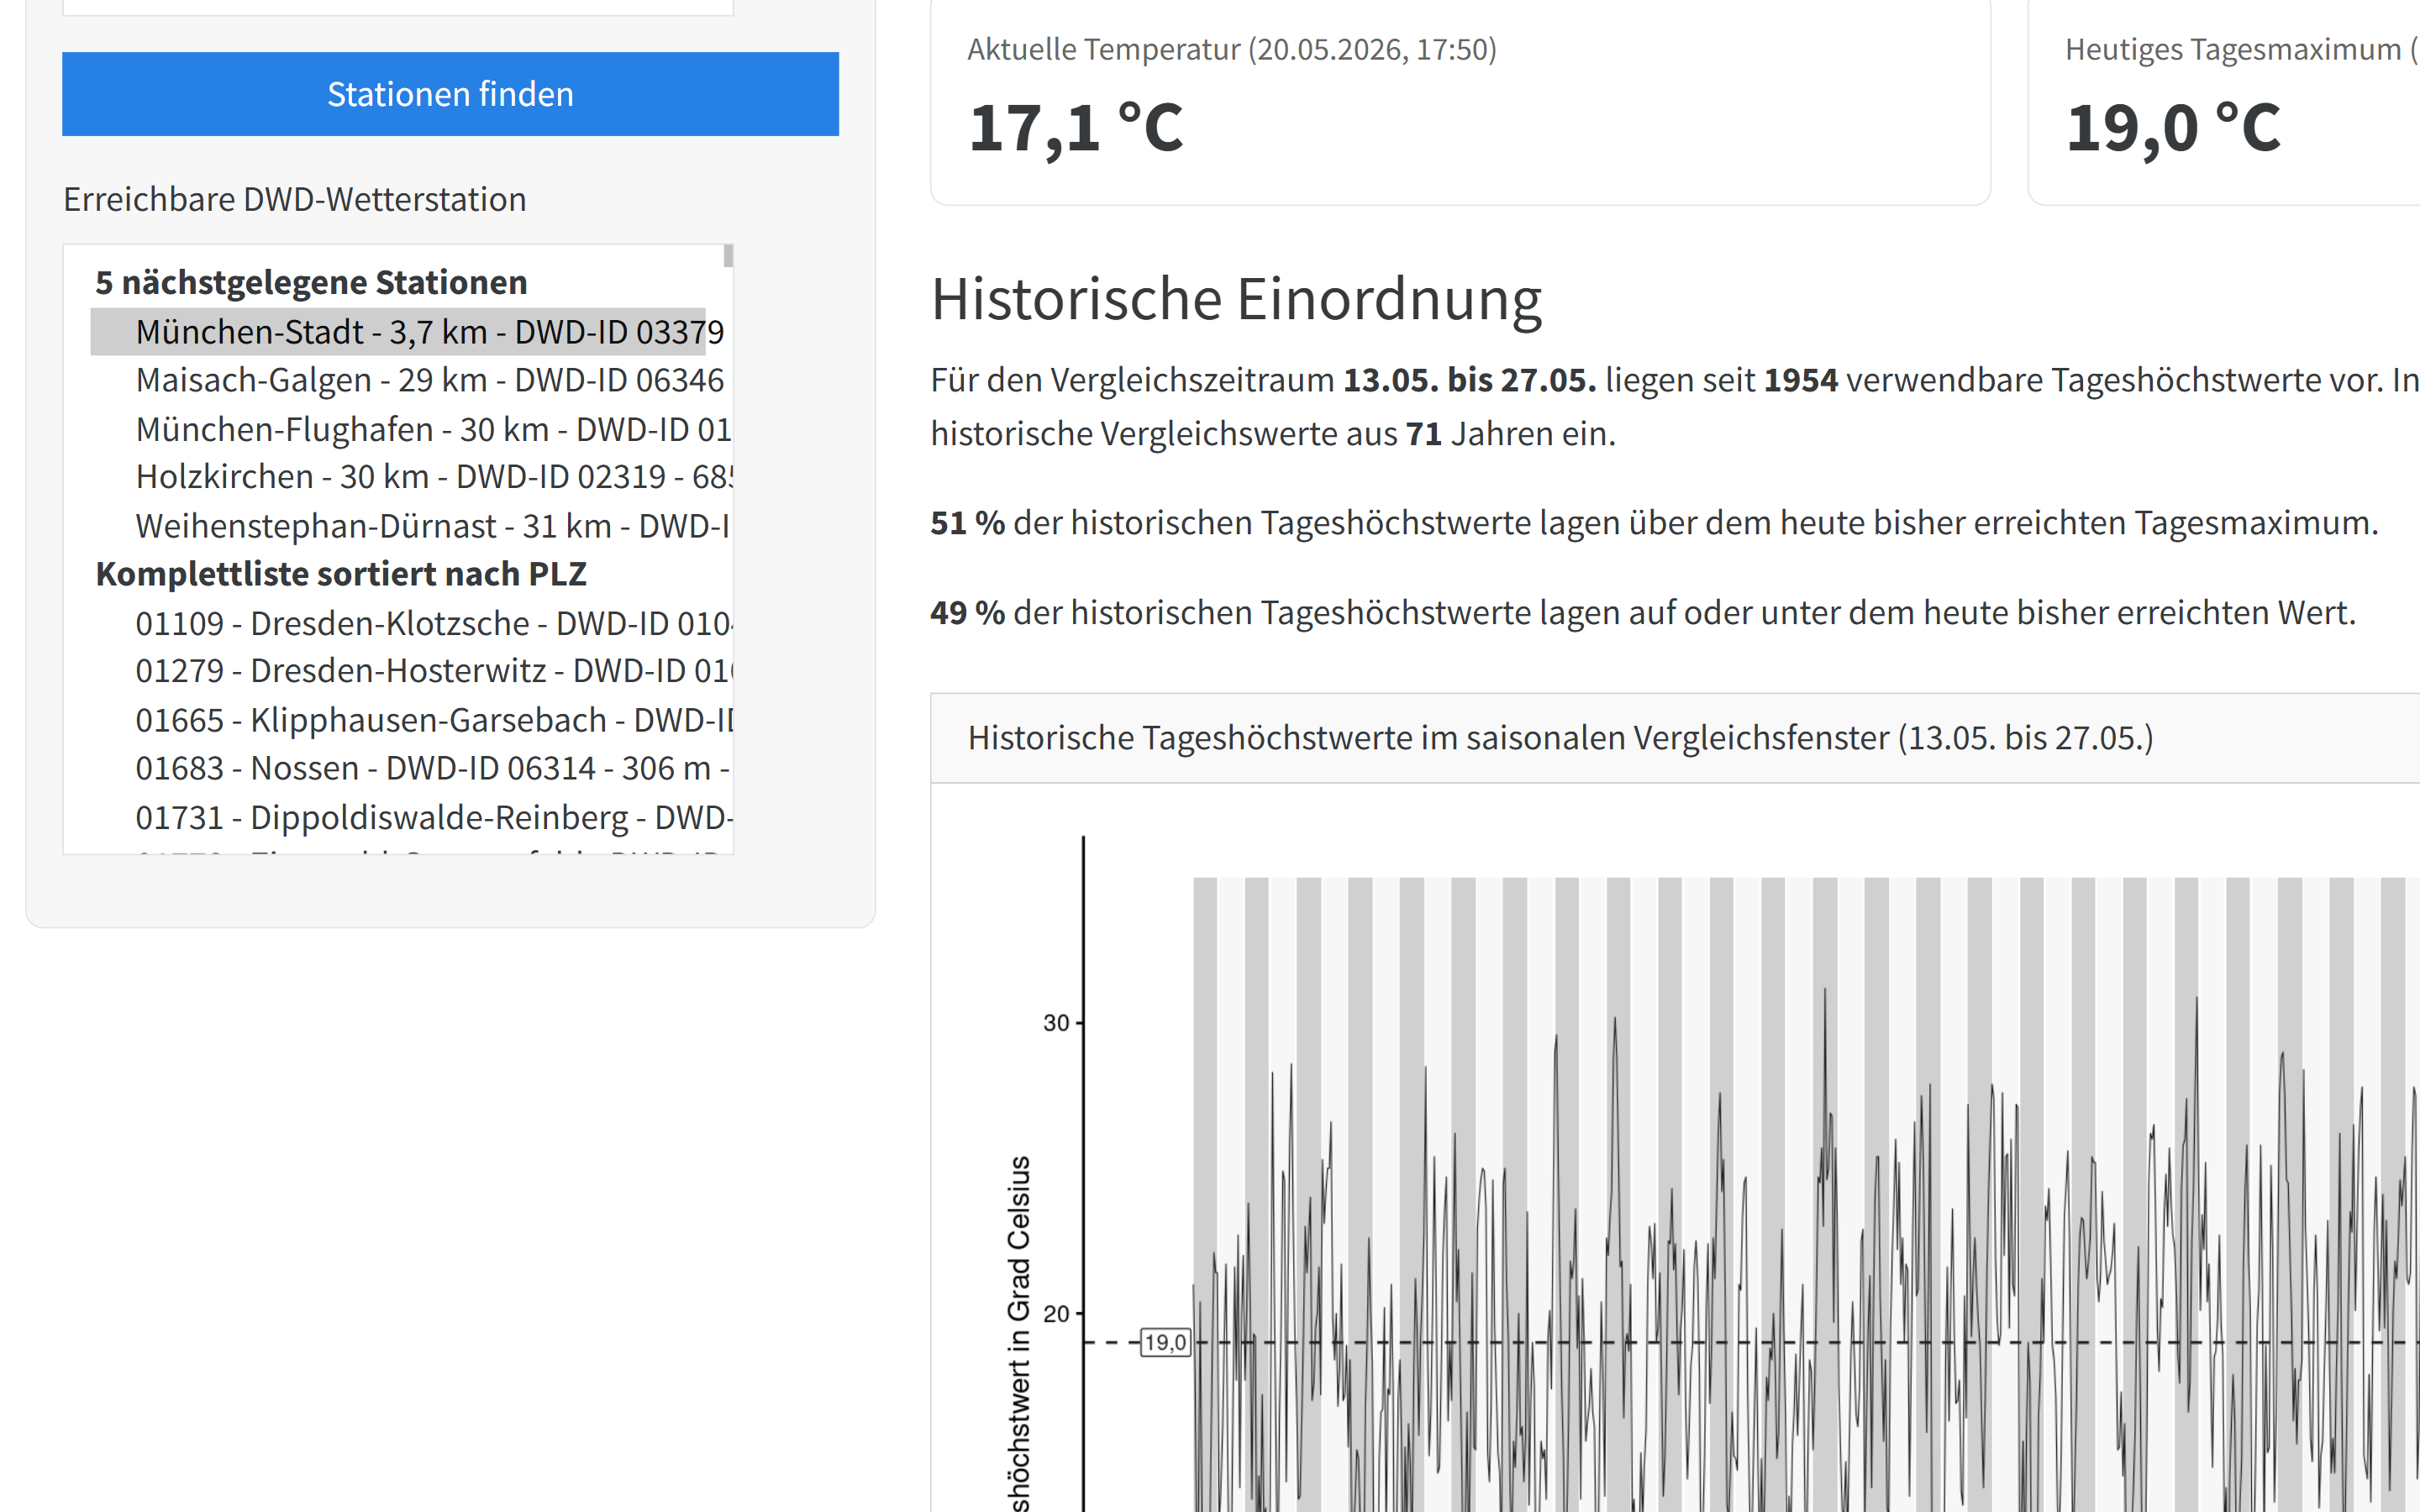
A small data product that uses measurements from official German weather stations to show where today’s highest temperature so far stands compared with historically observed daily highs at the same station.
Weather and climate are often discussed with high emotional intensity, while the underlying data is not always easy to access or interpret. This app makes official DWD measurements more accessible and helps place current temperatures at specific locations in historical context.
Status: Prototype
Topics: Public data, weather data, contextualization, Quarto, R
AI Tabulation App
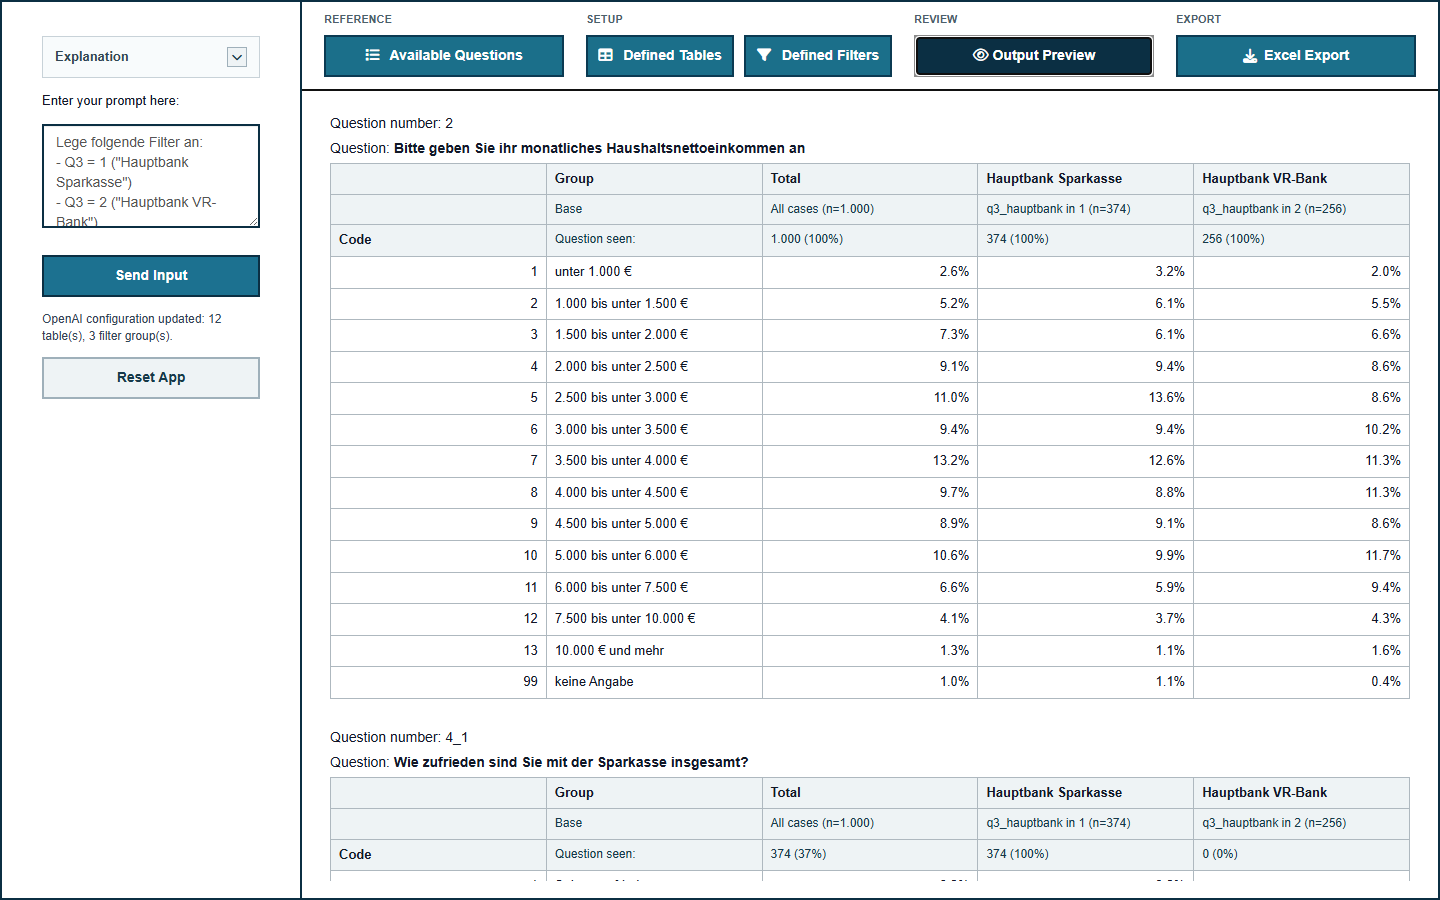
An AI-assisted prototype for extending standardized survey tracking tables with additional variables and ad-hoc breakouts in a predefined output format.
The app explores a common tracking use case: standardized tables are delivered regularly, but sometimes an additional survey variable or a non-standard breakout is needed quickly. Instead of designing arbitrary table layouts, the prototype keeps the output format fixed and uses prompts to define which variables should be tabulated and which filters or split groups should be applied. Users can review the generated setup, inspect the resulting table preview and export the output to Excel.
Status: Prototype
Topics: Survey data, AI-assisted workflows, tabulation, Excel export, R, Shiny